🐍 파이썬 (Python)
<matplotlib> (pylab) - 2D, 3D 데이터 자료 시각화
- -

matplot 라이브러리는 데이터를 차트(chart)나 플롯(plot) 형태, 2D,3D로 시각화하도록 기능합니다.
https://matplotlib.org/3.1.1/gallery/index.html
Gallery — Matplotlib 3.1.1 documentation
Gallery This gallery contains examples of the many things you can do with Matplotlib. Click on any image to see the full image and source code. For longer tutorials, see our tutorials page. You can also find external resources and a FAQ in our user guide.
matplotlib.org
위 링크의 공식 홈페이지에 들어가면, 각종 예제들이 많이 있습니다. 그중에 몇가지를 소개하자면,
Lines, bars and markers

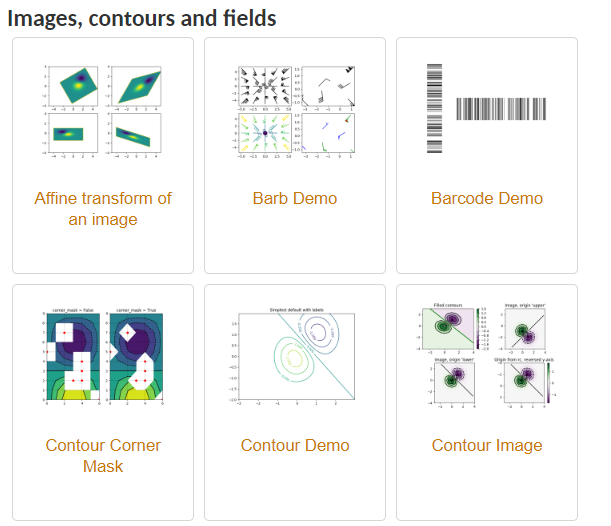
Images, contours and fields
이 외에도. 3D 플롯팅 형태도 제공합니다.
3D plotting

* pylab 서브 패키지
matplotlib의 하위에 pylab이라는 서브패키지가 존재합니다. (matplotlib는 전체를 포함하는 패키지이며 pylab은 matplotlib를 설치하면 자동으로 설치되는 모듈중 하나입니다.)
수치해석 소프트웨어로 유명한 matlab의 시각화 명령을 파이썬으로 구동할 수 있도록 구성된 명령어 집합을 제공합니다. 이를 이용해서 간단한 예제를 보겠습니다.
기본적인 명령어
from matplotlib import pyplot as plt  # plt로 임포트하는게 일반적이라고 합니다. (아무거나해도상관없긴 하지만)

1.plt.xlabel(' ') -  x축 레이블

2.plt.ylabel(' ') - y축 레이블

3.plt.title('  ') - 그래프 타이틀

4.plt.legend(['범례_1 ', ' 범례_2 ']) - 범례 추가

5.plt.show() - 시각화명령

----------------------------------------------------------------------------------------------
6.plt.plot(x, y , color="blue" )  - 플롯

7.plt.bar(x, y, width=0.7, color="blue" ) 바 차트

8.plt.pie(x , y) 파이차트

9.plt.hist(x, y ) 히스토그램
위에 기본 명령어를 사용해서 네이버를 주간날씨를 보고 인천과 서울의 온도그래프를 만들어보았습니다.

from matplotlib import pyplot as plt


plt.xlabel(' Date ')

plt.ylabel(' Temperature')

plt.title(" Seoul&Inchon Temperature ")


in_temp = [9,5,7,6,-1]
sl_temp = [4,4,5,5,-3]
date = ["11/15","11/16","11/17","11/18,","11,19"]
plt.plot(date, in_temp, color = "green")   #1
plt.plot(date, sl_temp , color= "Yellow")  #2
plt.legend(['Inchon', 'Seoul'])    #범례는 위 1,2 순서대로이므로 순서주의
plt.show()
'🐍 파이썬 (Python)' 카테고리의 다른 글
| <matplotlib> - 2D 실시간 그래프 2개 그리기. (animation) (0) | 2019.12.02 |
|---|---|
| CSV 파일 읽어들여서 highcharts + Flask 그래프 구현하기. (0) | 2019.11.16 |
| 데이터 베이스 시간 표시방법 - Timestamp (unix time) (0) | 2019.11.13 |
| 플라스크 (Flask) - 회원가입 기능 만들기 (MVC 패턴 ) (15) | 2019.11.06 |
| 파이썬 (python) - 외부파일 처리 Pandas ( 엑셀 XSL, XLSX 파일 읽기 , 쓰기 ) (0) | 2019.11.05 |
Contents
소중한 공감 감사합니다